


National and Regional Economically Active Population - QLFS Q1 2019
- Written by Gary Watkins
- Published in Articles

| National EAP by population group/race and gender (15-64yrs) | |||
| Male | Female | Both sexes | |
| Thousand | |||
| Black African | 9,626 | 8,088 | 17,714 |
| Coloured | 1,179 | 1,022 | 2,201 |
| Indian/Asian | 385 | 206 | 591 |
| White | 1,129 | 857 | 1,986 |
| Total | 12,319 | 10,174 | 22,492 |
| % | Male | Female | Both sexes |
| Black African | 42.8 | 36.0 | 78.8 |
| Coloured | 5.2 | 4.5 | 9.8 |
| Indian/Asian | 1.7 | 0.9 | 2.6 |
| White | 5.0 | 3.8 | 8.8 |
| Total | 54.8 | 45.2 | 100.0 |
| Source: Quarterly labour Force Survey, Q1 2019 | |||

| Provincial EAP by population group/race and gender (15-64yrs) | Provincial EAP by population group/race and gender (15-64yrs) % | |||||||||||
| Black African | Coloured | Indian/ Asian | White | Total | Black African | Coloured | Indian/ Asian | White | Total | |||
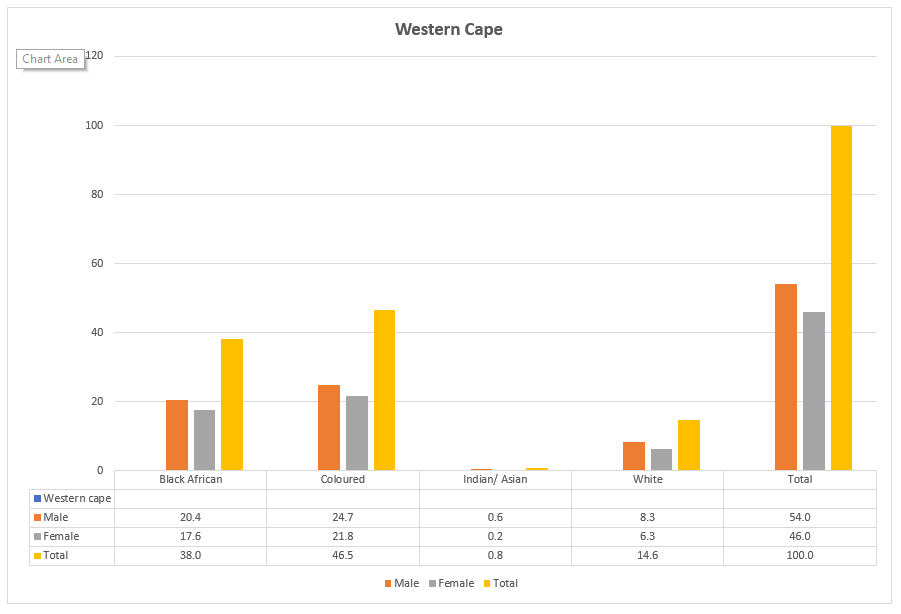
| Western cape | Western cape | |||||||||||
| Male | 639 | 773 | 19 | 259 | 1,691 | Male | 20.4 | 24.7 | 0.6 | 8.3 | 54.0 | |
| Female | 551 | 682 | 7 | 198 | 1,438 | Female | 17.6 | 21.8 | 0.2 | 6.3 | 46.0 | |
| Total | 1,190 | 1,456 | 26 | 458 | 3,130 | Total | 38.0 | 46.5 | 0.8 | 14.6 | 100.0 | |
| Black African | Coloured | Indian/ Asian | White | Total | ||||||||
| Eastern cape | Eastern Cape | |||||||||||
| Male | 866 | 125 | 14 | 79 | 1,084 | Male | 41.5 | 6.0 | 0.7 | 3.8 | 51.9 | |
| Female | 828 | 109 | 10 | 58 | 1,005 | Female | 39.6 | 5.2 | 0.5 | 2.8 | 48.1 | |
| Total | 1,694 | 233 | 24 | 137 | 2,089 | Total | 81.1 | 11.2 | 1.1 | 6.6 | 100.0 | |
| Black African | Coloured | Indian/ Asian | White | Total | ||||||||
| Northern Cape | Northern Cape | |||||||||||
| Male | 124 | 107 | 1 | 15 | 246 | Male | 28.7 | 24.6 | 0.1 | 3.3 | 56.7 | |
| Female | 87 | 87 | 14 | 188 | Female | 20.0 | 20.1 | 0.0 | 3.2 | 43.3 | ||
| Total | 211 | 194 | 1 | 28 | 434 | Total | 48.6 | 44.7 | 0.1 | 6.6 | 100.0 | |
| Black African | Coloured | Indian/ Asian | White | Total | ||||||||
| Free State | Free State | |||||||||||
| Male | 628 | 11 | 6 | 31 | 675 | Male | 50.9 | 0.9 | 0.4 | 2.5 | 54.7 | |
| Female | 519 | 12 | 4 | 24 | 559 | Female | 42.1 | 1.0 | 0.3 | 1.9 | 45.3 | |
| Total | 1,146 | 23 | 9 | 55 | 1,233 | Total | 92.9 | 1.9 | 0.8 | 4.4 | 100.0 | |
| Black African | Coloured | Indian/ Asian | White | Total | ||||||||
| KwaZulu-Natal | KwaZulu-Natal | |||||||||||
| Male | 1,508 | 36 | 179 | 78 | 1,802 | Male | 43.5 | 1.0 | 5.2 | 2.3 | 51.9 | |
| Female | 1,485 | 26 | 110 | 47 | 1,668 | Female | 42.8 | 0.7 | 3.2 | 1.3 | 48.1 | |
| Total | 2,993 | 62 | 289 | 125 | 3,469 | Total | 86.3 | 1.8 | 8.3 | 3.6 | 100.0 | |
| Black African | Coloured | Indian/ Asian | White | Total | ||||||||
| North West | North West | |||||||||||
| Male | 730 | 8 | 8 | 46 | 792 | Male | 55.4 | 0.6 | 0.6 | 3.5 | 60.1 | |
| Female | 488 | 6 | 2 | 30 | 526 | Female | 37.0 | 0.5 | 0.1 | 2.3 | 39.9 | |
| Total | 1,218 | 14 | 10 | 76 | 1,318 | Total | 92.4 | 1.1 | 0.7 | 5.8 | 100.0 | |
| Black African | Coloured | Indian/ Asian | White | Total | ||||||||
| Gauteng | Gauteng | |||||||||||
| Male | 3,290 | 97 | 138 | 538 | 4,063 | Male | 45.3 | 1.3 | 1.9 | 7.4 | 55.9 | |
| Female | 2,596 | 92 | 70 | 442 | 3,200 | Female | 35.7 | 1.3 | 1.0 | 6.1 | 44.1 | |
| Total | 5,886 | 189 | 208 | 980 | 7,263 | Total | 81.0 | 2.6 | 2.9 | 13.5 | 100.0 | |
| Black African | Coloured | Indian/ Asian | White | Total | ||||||||
| Mpumalanga | Mpumalanga | |||||||||||
| Male | 927 | 8 | 8 | 57 | 1,000 | Male | 50.5 | 0.4 | 0.4 | 3.1 | 54.4 | |
| Female | 801 | 4 | 32 | 837 | Female | 43.6 | 0.2 | 0.0 | 1.7 | 45.6 | ||
| Total | 1,728 | 12 | 8 | 88 | 1,837 | Total | 94.1 | 0.6 | 0.4 | 4.8 | 100.0 | |
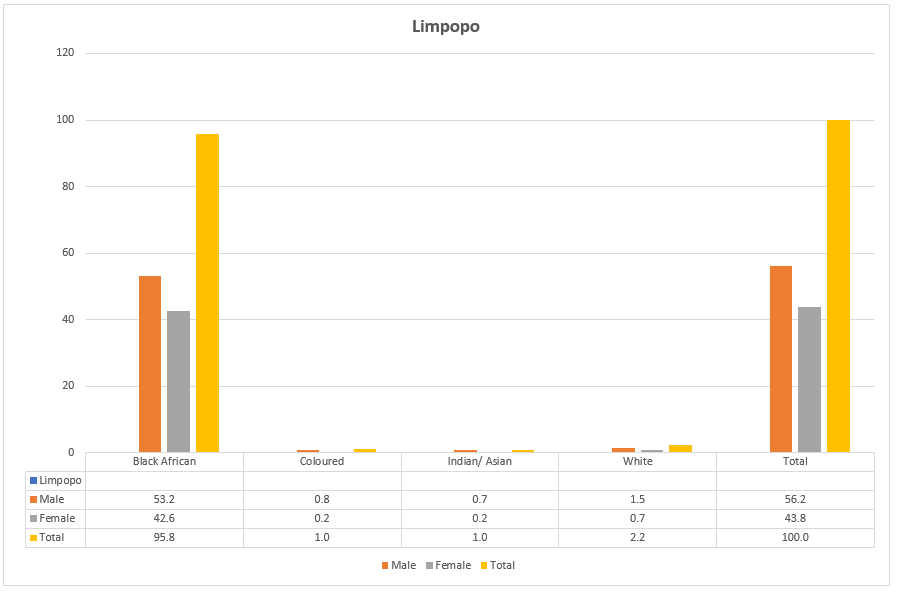
| Black African | Coloured | Indian/ Asian | White | Total | ||||||||
| Limpopo | Limpopo | |||||||||||
| Male | 914 | 14 | 12 | 26 | 966 | Male | 53.2 | 0.8 | 0.7 | 1.5 | 56.2 | |
| Female | 733 | 3 | 4 | 13 | 753 | Female | 42.6 | 0.2 | 0.2 | 0.7 | 43.8 | |
| Total | 1,647 | 17 | 17 | 38 | 1,719 | Total | 95.8 | 1.0 | 1.0 | 2.2 | 100.0 | |


Last modified onFriday, 17 May 2019 22:54
Warning: count(): Parameter must be an array or an object that implements Countable in /home/gwdhmoih/public_html/templates/gk_news2/html/com_k2/templates/default/item.php on line 176

Gary Watkins
Gary Watkins
Managing Director
BA LLB
C: +27 (0)82 416 7712
T: +27 (0)10 035 4185 (Office)
F: +27 (0)86 689 7862
Website: www.workinfo.comRelated items
- Employment and Labour on tabling of Amended Employment Equity Bill
- National and Regional Economically Active Population - QLFS Q2 2019
- Amendment to EEA Regulations: New format for EEA4
- National and Regional Economically Active Population - QLFS Q4 2018
- “No employment equity compliance, no business” with the State and its entities – Department of Labour
Latest from Gary Watkins
- National and Regional Economically Active Population Profile QLFS Q3:2021
- National and Regional Economically Active Population Profile QLFS Q2:2021
- Consolidated Directions on Occupational Health and Safety Measures in certain workplaces as at 11 June 2021
- COVID19TERS Benefits as at 20 July 2021
- Adjusted Level 3 Lockdown - 25 July 2021
Image Gallery


View the embedded image gallery online at:
https://www.workinfo.wiki/index.php/articles/item/2022-national-and-regional-economically-active-population-qlfs-q4-2019#sigProId51d7c10a54
https://www.workinfo.wiki/index.php/articles/item/2022-national-and-regional-economically-active-population-qlfs-q4-2019#sigProId51d7c10a54
Login to post comments


